In the world of software architecture, clear communication is paramount. Complex systems demand a way to convey structure, interactions, and design decisions to stakeholders ranging from developers to business leaders. The C4 model, developed by Simon Brown, is a lightweight, intuitive framework for visualizing software architecture. It breaks down systems into hierarchical diagrams that balance detail and abstraction, making it easier to understand and communicate system design. In this blog post, we’ll explore the C4 model, its core concepts, and how it can be effectively applied within the Microsoft Dynamics 365 and Power Platform ecosystems to architect robust, scalable, and maintainable solutions.
What is the C4 Model?
The C4 model is a structured approach to visualizing software architecture through a set of diagrams that progressively zoom in on a system’s components. The name “C4” stands for Context, Containers, Components, and Code, representing the four levels of abstraction in the model. Each level provides a different perspective, catering to various audiences and purposes, from high-level overviews for non-technical stakeholders to detailed technical designs for developers.
The Four Levels of the C4 Model
1. System Context Diagram (Level 1)
- Purpose: Provides a high-level overview of the system, showing how it fits into its environment and interacts with external users or systems.
- Audience: Business stakeholders, executives, and non-technical team members.
- Content: The system as a single entity, its users (people or roles), and external systems it interacts with.
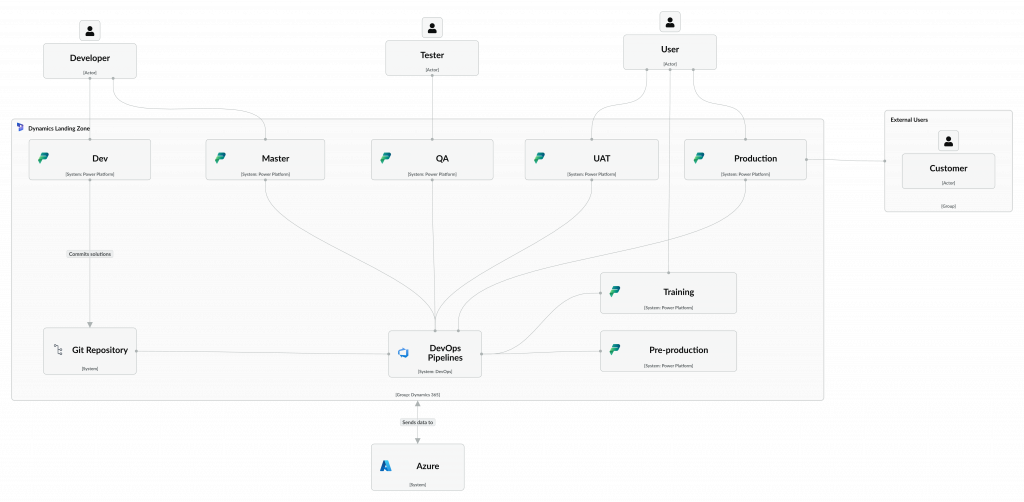
- How I use them: A diagram showing a Landing Zone of Power Platform Environments and which personas interact with each environment.
2. Container Diagram (Level 2)
- Purpose: Zooms into the system to show its major structural elements (containers) and their interactions.
- Audience: Technical stakeholders, architects, and developers.
- Content: Containers (e.g., applications, databases, services) within the system, their responsibilities, and how they communicate (e.g., APIs, queues).
- How I use them: A diagram illustrating a Dynamics 365 instance, drilling down from our Landing Zone Context Diagram to our Production environment in the example diagram below.
3. Component Diagram (Level 3)
- Purpose: Drills down into a specific container to show its internal components and their interactions.
- Audience: Developers and technical leads.
- Content: Components (e.g., modules, services, or plugins) within a container, their responsibilities, and how they interact.
- How I use them: A diagram detailing the plugins, custom workflows, and business logic within a Dynamics 365 app.
4. Code Diagram (Level 4)
- Purpose: Provides the most detailed view, showing the implementation details of components, often at the code level.
- Audience: Developers working on implementation.
- Content: Class diagrams, sequence diagrams, or other UML-like representations of code structure.
- How I use them: I dont, in the real world, documentation at this level should be automated from the code.
The C4 model is flexible and tool-agnostic, allowing architects to create diagrams using tools like Icepanel.io, Viso, Draw.io, or even PowerPoint. Its strength lies in its simplicity and ability to scale from high-level overviews to granular details without overwhelming the audience.
Why Use the C4 Model in Dynamics 365 and Power Platform?
Dynamics 365 and Power Platform are powerful ecosystems for building enterprise-grade business applications, but their flexibility can lead to complexity. Solutions often involve multiple components—model-driven apps, canvas apps, Power Automate flows, Dataverse, Azure integrations, and more—interacting in intricate ways. The C4 model is particularly valuable in this context for several reasons:
- Clarity Across Stakeholders: Dynamics 365 and Power Platform projects involve diverse stakeholders, including business users, citizen developers, pro developers, and IT teams. The C4 model’s layered approach ensures each group gets the level of detail they need without being overwhelmed.
- Managing Complexity: Solutions often integrate Dynamics 365 (e.g., Sales, Finance and Operations, Customer Service) with Power Platform components (e.g., Power Apps, Power Automate, Power BI) and external systems. The C4 model helps visualize these interactions, making it easier to identify dependencies and potential bottlenecks.
- Supporting Low-Code Development: Power Platform emphasizes low-code development, enabling rapid prototyping and deployment. The C4 model provides a structured way to document and communicate designs, ensuring that low-code solutions remain maintainable and scalable.
- Alignment with ALM: Application Lifecycle Management (ALM) is critical in Power Platform and Dynamics 365 to manage solutions across development, testing, and production environments. The C4 model supports ALM by providing clear documentation that can guide deployment and governance processes.
- Facilitating AI and Automation: With the rise of AI-driven features like Dynamics 365 Copilot and Power Platform’s generative AI capabilities, architectures are becoming more dynamic. The C4 model helps architects map out how AI agents, flows, and data models interact within the ecosystem.
Applying the C4 Model to Dynamics 365 and Power Platform
Let’s walk through a practical example of using the C4 model to architect a solution in Dynamics 365 and Power Platform. Suppose a company wants to build a Customer Support System that integrates Dynamics 365 Customer Service, a Power App for field technicians, Power Automate for automated case routing, and Power BI for reporting, with an external ticketing system.
Step 1: System Context Diagram (Level 1)
Objective: Provide a high-level view of the Customer Support System and its external interactions.
Diagram Elements:
- System: Customer Support System (the Dynamics 365 and Power Platform solution).
- Actors:
- Customers (submit tickets via a portal).
- Support Agents (use Dynamics 365 to manage cases).
- Field Technicians (use a Power App for on-site tasks).
- External Systems:
- External Ticketing System (sends/receives ticket data).
- Email Server (sends notifications).
Example Description: The Customer Support System allows customers to submit tickets through a Power Pages portal, which are managed by support agents in Dynamics 365 Customer Service. Field technicians access work orders via a Power App, and the system syncs with an external ticketing system for cross-platform consistency. Power BI dashboards provide insights into case resolution times.
Diagram:
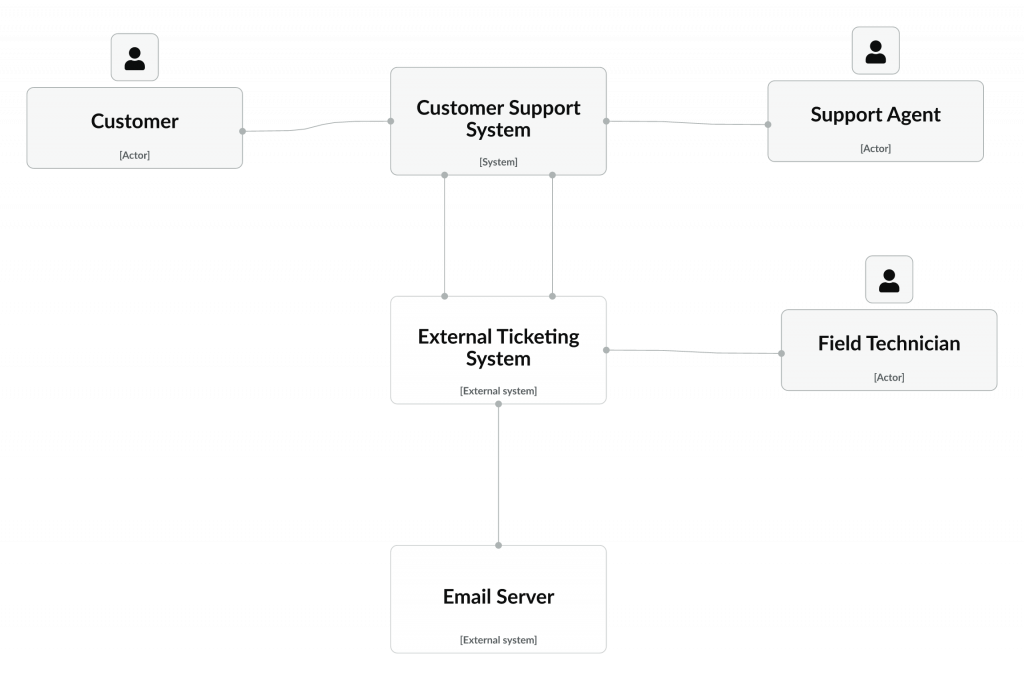
This diagram is simple enough for executives to understand the system’s purpose and scope.
Step 2: Container Diagram (Level 2)
Objective: Show the major technological components (containers) within the Customer Support System and their interactions.
Diagram Elements:
- Containers:
- Dynamics 365 Customer Service: Handles case management and SLA tracking.
- Power App (Field Technician App): Mobile app for technicians to view and update work orders.
- Power Automate: Orchestrates automated workflows, such as case routing and email notifications.
- Power Pages Portal: Customer-facing portal for ticket submission.
- Power BI: Generates analytical dashboards.
- Dataverse: Centralized data storage for cases, work orders, and customer data.
- Azure API Management: Manages integration with the external ticketing system.
- Interactions:
- Dynamics 365 Customer Service stores data in Dataverse.
- Power Automate triggers workflows based on Dataverse events.
- Power App retrieves work orders from Dataverse.
- Power Pages submits tickets to Dataverse.
- Power BI pulls data from Dataverse for reporting.
- Azure API Management facilitates secure communication with the external ticketing system.
Example Description: The Dynamics 365 Customer Service app manages cases, storing data in Dataverse. Power Automate monitors Dataverse for new cases and routes them to agents or technicians based on predefined rules. The Field Technician Power App retrieves work orders from Dataverse, allowing technicians to update statuses on the go. Customers submit tickets via a Power Pages portal, which are stored in Dataverse. Power BI connects to Dataverse to generate performance dashboards. Azure API Management handles secure data exchange with the external ticketing system.
Diagram:
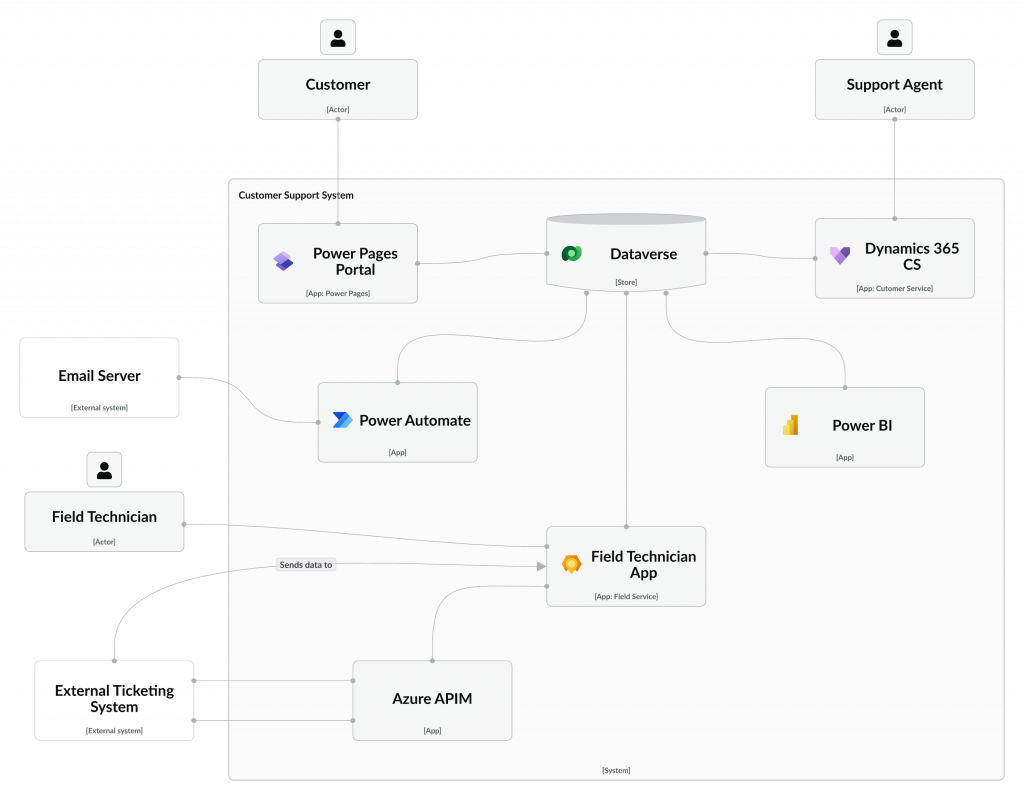
This diagram helps technical stakeholders understand the system’s architecture and integration points.
Step 3: Component Diagram (Level 3)
Objective: Zoom into a specific container (e.g., Dynamics 365 Customer Service) to show its internal components.
Diagram Elements:
- Container: Dynamics 365 Customer Service.
- Components:
- Case Management Module: Handles case creation, updates, and closures.
- SLA Tracking Plugin: Custom plugin to enforce service-level agreements.
- Copilot Integration: Uses natural language processing for case summaries.
- Business Rules Engine: Configures case routing logic.
- Interactions:
- Case Management Module interacts with Dataverse to store case data.
- SLA Tracking Plugin triggers notifications via Power Automate.
- Copilot Integration generates summaries and stores them in Dataverse.
- Business Rules Engine applies routing logic based on case attributes.
Example Description: Within Dynamics 365 Customer Service, the Case Management Module allows agents to create and manage cases, storing data in Dataverse. A custom SLA Tracking Plugin monitors case progress and triggers Power Automate flows for overdue cases. The Copilot Integration uses AI to generate case summaries, enhancing agent efficiency. The Business Rules Engine applies logic to route cases to appropriate queues or agents.
Diagram:
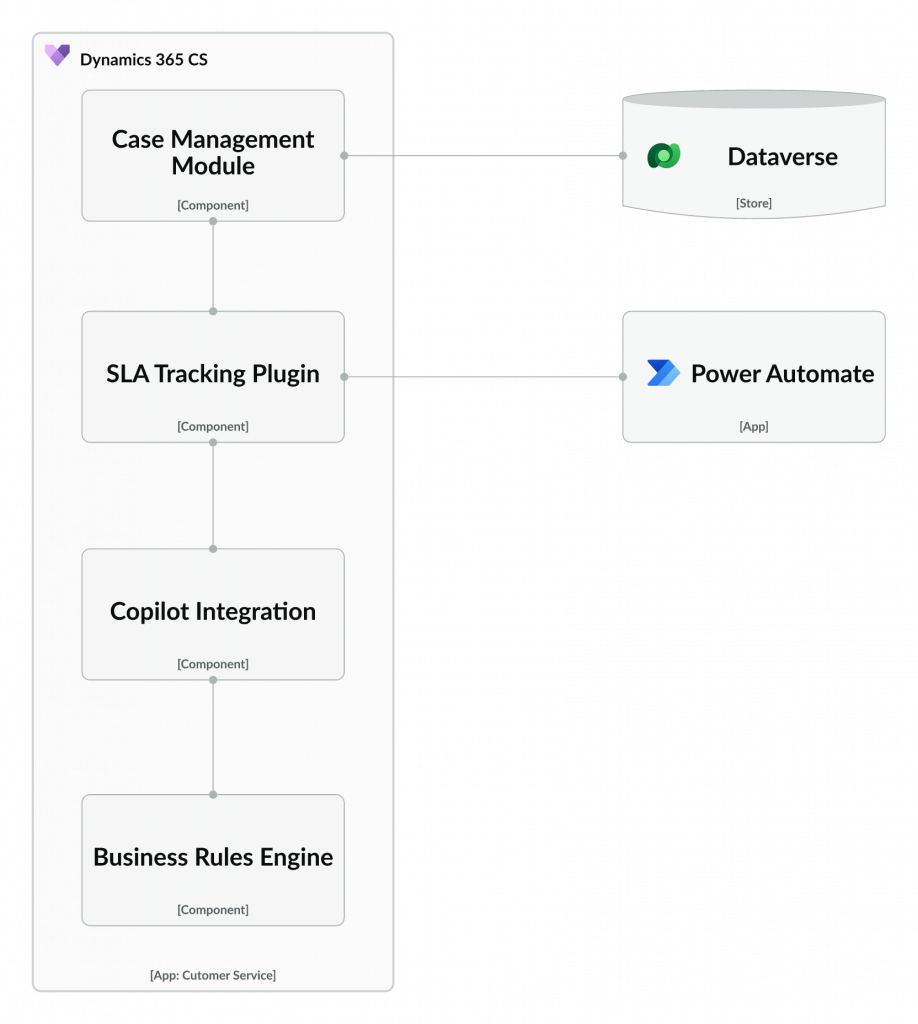
This diagram is useful for developers implementing or customizing Dynamics 365 Customer Service.
Step 4: Code Diagram (Level 4)
Just don’t!
Best Practices for Using the C4 Model in Dynamics 365 and Power Platform
- Start with Context: Always begin with a System Context Diagram to align stakeholders on the solution’s purpose and scope. This is especially important in Dynamics 365 projects, where business requirements drive technical design.
- Leverage Dataverse as the Core: In Power Platform solutions, Dataverse often serves as the central data layer. Highlight Dataverse in Container Diagrams to show its role in unifying data across Dynamics 365, Power Apps, and Power BI.
- Incorporate ALM Considerations: Use Container and Component Diagrams to document ALM processes, such as solution layering (managed vs. unmanaged solutions) and deployment pipelines. This ensures architectures support robust governance.
- Highlight AI and Automation: With Dynamics 365 Copilot and Power Platform’s AI capabilities, include AI-driven components (e.g., Copilot agents, AI Builder models) in Component Diagrams to show their integration.
- Keep Diagrams Lightweight: Avoid overloading diagrams with excessive detail. Use annotations or separate documentation for complex logic, especially in low-code environments where configurations (e.g., Power Automate flows) replace traditional code.
- Iterate and Validate: As Dynamics 365 and Power Platform solutions evolve, update C4 diagrams to reflect changes. Validate diagrams with stakeholders to ensure accuracy and alignment.
- Use Tools Wisely: Tools like IcePanel.io or Microsoft Visio can streamline diagram creation. For Power Platform, consider embedding diagrams in solution documentation within Dataverse or Power Apps portals for easy access.
- Don’t use Code diagrams (level 4): For Dynamics 365 and Power Platform I recommend that you don’t use them, instead, ensure Code Diagrams are automatically generated from the code.
Challenges and Considerations
While the C4 model is highly effective, applying it in Dynamics 365 and Power Platform comes with challenges:
- Low-Code Complexity: Low-code platforms can lead to sprawling solutions with numerous flows, apps, and connectors. Component Diagrams must balance simplicity with enough detail to capture key configurations.
- Dynamic Environments: Frequent updates to Dynamics 365 and Power Platform (e.g., release waves) may require regular diagram updates to reflect new features or deprecated components.
- Stakeholder Alignment: Ensuring all stakeholders understand and agree on diagram content can be challenging, especially when balancing technical and business perspectives.
- Integration Complexity: Integrations with external systems (e.g., via Azure API Management) require careful documentation in Container Diagrams to avoid overlooking security or performance issues.
Conclusion
The C4 model is a powerful tool for architecting and communicating solutions in Dynamics 365 and Power Platform. Its hierarchical approach—spanning System Context, Container, Component, and Code levels—provides clarity and structure, making it easier to design, implement, and maintain complex business applications. By applying the C4 model, architects can bridge the gap between business requirements and technical implementation, ensuring solutions are scalable, maintainable, and aligned with organizational goals.
Whether you’re building a customer support system, a retail inventory solution, or any other enterprise application, the C4 model can help you visualize and manage complexity. Start with a System Context Diagram to align stakeholders, use Container and Component Diagrams to guide development, and leverage Code Diagrams for detailed implementation. With the rapid evolution of Dynamics 365 and Power Platform—driven by AI, automation, and low-code innovation—the C4 model is more relevant than ever.
Quick Review of IcePanel.io and Why I Recommend a Living Model
I used IcePanel.io to create the diagrams in this post, like the System Context Diagram for the Power Platform Environments Landing Zone, IcePanel.io is a web-based tool for collaborative C4 model diagramming, and its drag-and-drop interface made it super easy to map out the Dynamics 365 and Power Platform setup. I could zoom between C4 levels, keeping everything consistent.
So, why build a living model of your architecture? Like I mentioned in the post, Dynamics 365 and Power Platform are always changing—new release waves, AI updates like Copilot, or shifting business needs can shake things up fast. A living model, like the one I built with IcePanel.io, keeps your architecture current as these changes happen. For example, if we tweak a Power Automate flow or update Dataverse in the Customer Support System, I can update the model, and everyone—devs, testers, execs—sees the latest setup instantly. It’s a single source of truth, and helps catch issues like integration bottlenecks early. For Dynamics 365 and Power Platform projects, a living model keeps your solutions scalable and manageable, and IcePanel.io makes it a breeze to maintain!

 PensPlace